Echarts图表的柱状图和漏洞图形怎么将数据值显示出来
- JS
- 时间:2021-03-04 17:47
- 8822人已阅读
简介
Echarts图标是百度开源的,捐献个apache了。现在demo示例官网地址:https://echarts.apache.org/examples/zh/index.html当我们使用柱状图的时候,想要将数据显示在上面怎么办?显示方式:在series对象中有个label属性。添加如下: label: { show: t
🔔🔔🔔好消息!好消息!🔔🔔🔔
有需要的朋友👉:联系凯哥
Echarts图标是百度开源的,捐献个apache了。现在demo示例官网地址:https://echarts.apache.org/examples/zh/index.html
本文将要讲解柱状图和漏斗怎么显示数据。
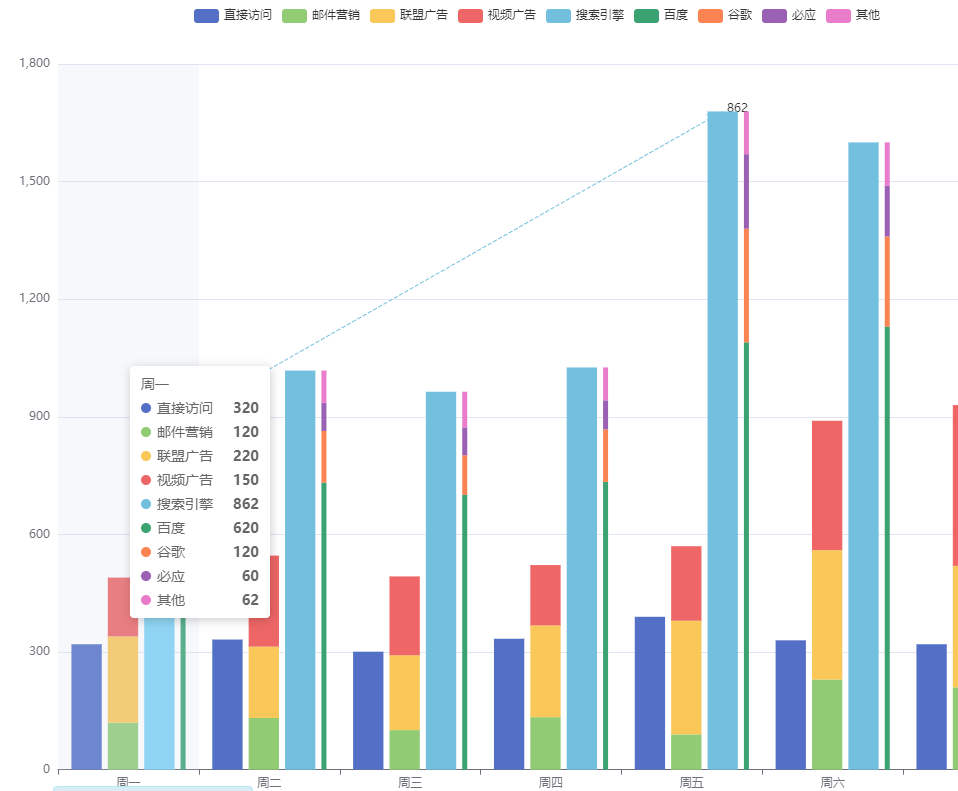
一:柱状图
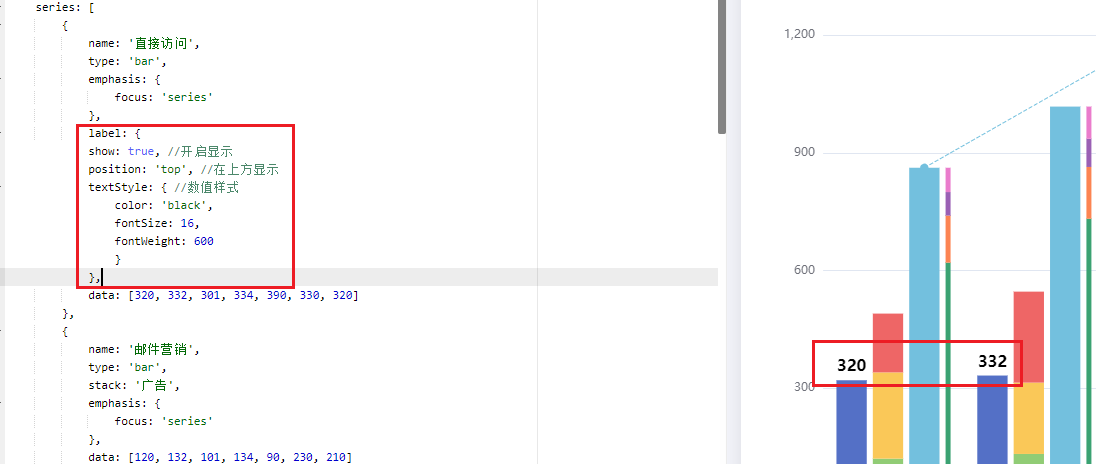
当我们使用柱状图的时候,想要将数据显示在上面怎么办?
显示方式:
在series对象中有个label属性。添加如下:
 label: {
    		show: true, //开启显示
    		position: 'top', //在上方显示
    		textStyle: { //数值样式
    		    color: 'black',
    			fontSize: 16,
    			fontWeight: 600
    			}
    		}
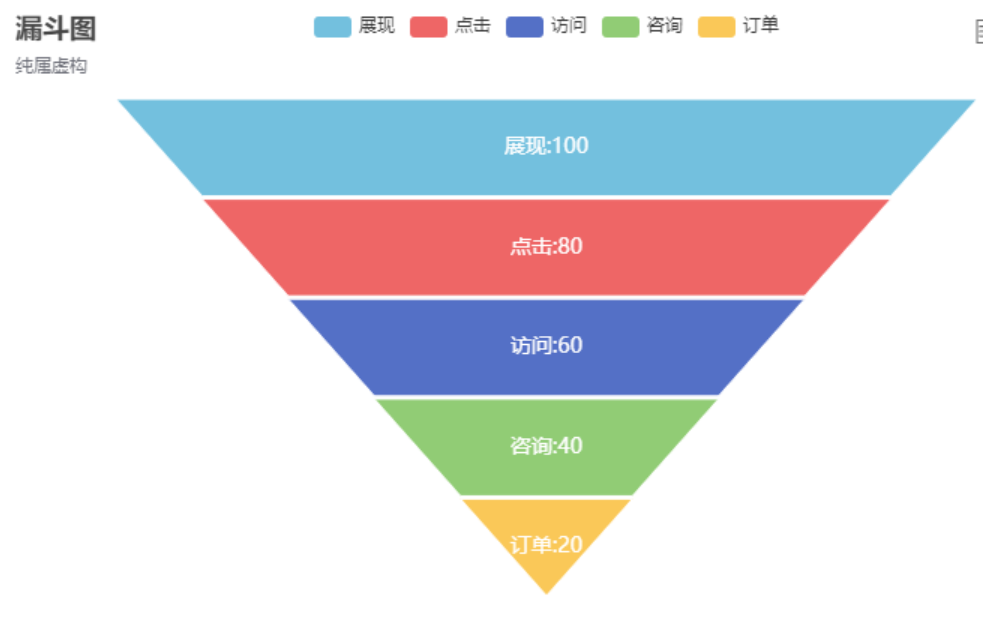
二:在漏斗图上显示数据
效果图:

修改的重点:
在series对象中的label属性中添加:
 formatter: "{b|{b}}"+"{b|:}"+"{a|{c}}",
                rich: {
                a: {
                    color: '#ffffff',
                    fontSize: 14
                },
                b: {
                color: '#ffffff',
                fontSize: 14
                }
完整的:
 label: {
                show: true,
                position: 'inside',
                formatter: "{b|{b}}"+"{b|:}"+"{a|{c}}",
                rich: {
                a: {
                    color: '#ffffff',
                    fontSize: 14
                },
                b: {
                color: '#ffffff',
                fontSize: 14
                }
            }
从上面两个例子中,我们可以发现,都是在label属性上修改